


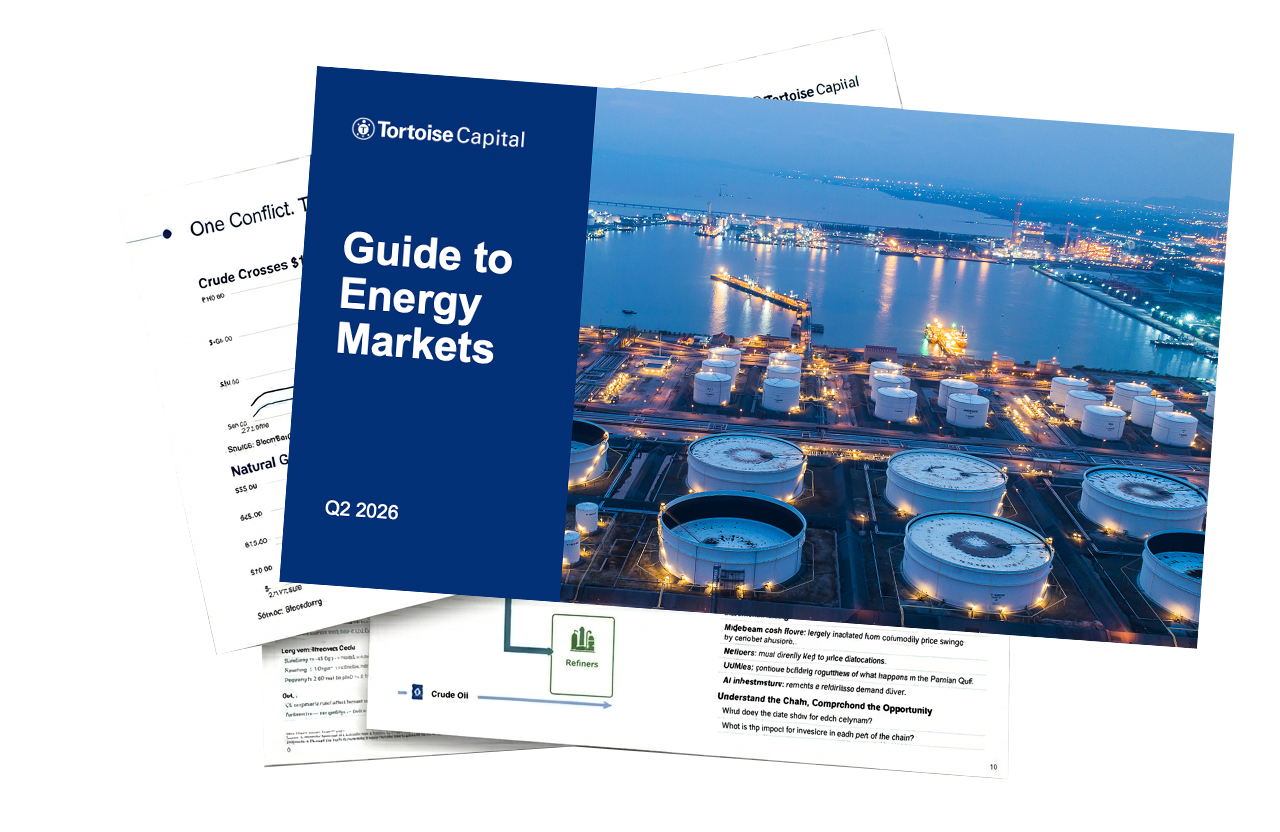
Guide to Energy
Use this informative quarterly resource to help illustrate the key forces shaping the evolution of energy investing.
Discover the Forces Fueling the Energy Growth Era
Energy may be one of the most under-owned sectors relative to its role in the economy. This video highlights what you can expect to find in our Guide to Energy. Dive into the Guide to learn more about key events driving the sector’s transformation and growth, the effect of current events, the longevity of the sector’s growth, and initiatives driving the producers and users.

Points of Interest in This Quarter’s Guide
Designed to help you connect energy infrastructure to potential portfolio opportunity, every page in the guide is built to help answer questions you may have about energy.
Here are some of the points covered in the current guide.
- How has the conflict with Iran affected crude oil and natural gas?
- Where are the opportunities in the energy value chain?
- Why aren’t oil producers drilling at $100 oil?
- Why is midstream cash flow experiencing record cash flows?
- Where do electricity demand and load growth stand?
- Has AI infrastructure demand been affected by the conflict?
Why Energy Matters
Energy powers everything from homes to global industries and supply chains. Rapidly rising global energy demand—driven by economic growth, expanding international markets, and AI infrastructure—is accelerating investment. As a leading oil and natural gas producer, the United States continues to strengthen its role in global energy security and export markets.

The Importance of the Full Energy Value Chain
The energy sector continues to evolve. As energy specialists with over 20 years of experience, Tortoise Capital is at the forefront of today’s global evolution. We invest across the entire energy value chain identifying companies with free cash flow, shareholder-friendly capital allocation, and exposure to structural growth trends that span technology, the global economy, and national security.
Upstream
Cash flows rise with crude prices, but capital discipline limits incremental drilling. Producers are returning cash to shareholders, not chasing rigs.
Midstream
Fee-based revenue means the conflict is largely noise. Tolls collected on volumes — not prices. Capital is accumulating faster than it can be deployed.
Refiners
Most directly tied to price dislocations. The widening Brent–WTI spread funnels straight into U.S. refiner margin. Crack spreads up sharply.
Power & Utilities
Capital programs driven by load growth, not commodity cycles. Utilities continue building regardless of what happens in the Persian Gulf.
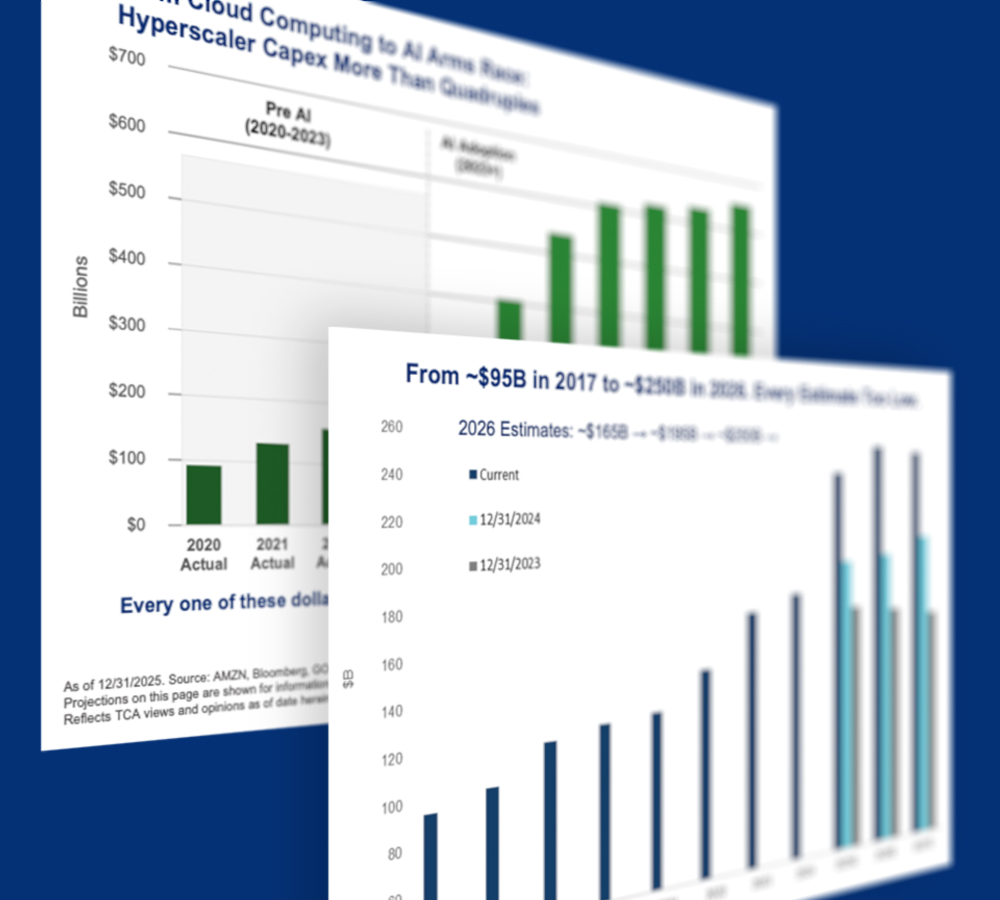
AI Infrastructure
At the end of the chain, reshaping the system before the conflict. Hyperscaler capex on a vertical curve. Energy is the binding constraint.
Stay Informed on the Energy Sector
Access key insights around the trends and drivers leading the energy transformation.
Download the Tortoise Capital Energy Guide now.
Contact Us
Questions? Reach out to the industry experts in energy investing.